XRP holders are reeling after a sharp 18% plunge throughout November, with the token crashing below $2 to close the month at $2.01 USD . Despite the excitement of multiple spot ETF launches drawing $164 million on day one, XRP couldn’t dodge the broader market storm, losing over $20 billion in market value in a single week. Now trading at $2.01 USD with a $121.47 billion market cap and $4.28 billion in 24-hour volume , XRP is testing critical support amid whale sells and fading hype. This SEO-optimized market news guide dissects the crash causes, technical fallout, and whether a rebound to $2.50+ is on the horizon before year-end.
For real-time insights, track the live XRP price, order book depth, and interactive charts directly on Tapbit price.
The November Bloodbath: XRP’s 18% Drop – A Timeline Of The Meltdown
XRP’s month started with promise but unraveled into chaos. Key moments:
- Early November Rally: +5% to $2.40 on ETF launch buzz, with $164M inflows for Grayscale/Franklin products.
- Mid-Month Crack: November 14 saw a 7.3% slide to $2.30, shattering $2.36 support as BTC hit $80K.
- Late-November Carnage: November 26 delivered a 30% overnight wipeout to $2.01, liquidating $1.14M in longs and erasing $20B in value.
- Month-End Close: -18% overall, down 40% from YTD highs, echoing October 2024’s slump.
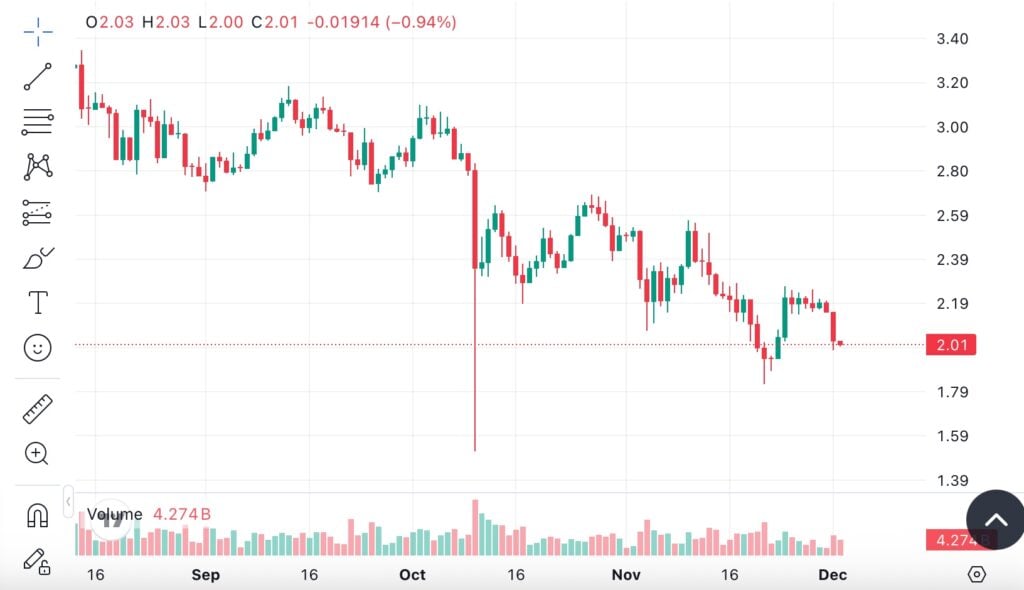
CoinMarketCap data underscores the pain: Circulating supply at 60.33 billion XRP (60.33% of 100 billion max), FDV at $201 billion, and a 24-hour range of $1.99-$2.06. Volume at $4.28B (+22.82%) shows resilient trading, but the -0.8% daily change signals ongoing pressure.
Why XRP Crashed 18% In November: ETF Hype Meets Market Reality
The drop wasn’t random – it was a collision of factors:
- Market-Wide Sell-Off: BTC’s dip to $80K dragged XRP (0.92 correlation), with ETH/SOL down 5-7% – ETF joy couldn’t counter the tide.
- Whale Exodus: -90.14M XRP outflows from long-term holders by October 30 (CryptoQuant), short-term supply down 39.5% as whales cashed out.
- Leverage Carnage: $1.14M in longs liquidated in 12 hours (Nov 26), a 3,554% short imbalance per U.Today.
- Hype Fade: $164M ETF inflows sparked “sell-the-news,” with SEC uncertainty lingering despite approvals.
- Technicals: Broke $2.28 support, BBP negative confirming downtrend – Hodl Waves reveal 1-3 month holders fleeing.
Market Sentiment: From ETF Highs To November Lows
November opened at 70% bullish on ETF launches but plunged to 55% bearish by end-month. Voices:
- Bearish Echoes: @DaMeta1_ (1994044606607188401) blamed “whale dumps” (400 likes); CCN eyed $1.25 (38% drop) via Fibonacci.
- Bull Holdouts: @kvpc (1993846261762674710) spotted “higher lows” for 2026 ATH (300 likes); BeInCrypto predicted $2.55 EOY if $2.60 holds.
- X Trends: “XRP drop November” at 15K mentions (+25% WoW), polls 55% bearish/45% bullish.
Fear & Greed at 24 (Extreme Fear) captures the chill.
Technical Analysis: $2.00 Support Or $1.60 Bottom?
XRP’s chart screams caution:
- Current Levels: $2.01, below $2.28 support – BBP negative locks in downtrend.
- Resistance: $2.60 (29%), $2.81 (40%) for rebound.
- Support: $2.00 (0%), $1.85 (8%), $1.60 (20%) – failure eyes $1.25 (38%).
- Indicators: RSI 45.89 (neutral), 11/30 green days (37%), volatility 6.50%.
CoinCodex forecasts $1.99 EOY (-0.99%), but $2.55 if $2.60 holds.
XRP’s November Crash – A Wake-Up Or Buying Opportunity?
At $2.01 with a $121.47 billion market cap, XRP’s 18% November drop highlights ETF hype’s limits, with $4.28B volume showing resilience but -0.8% daily change signaling caution. A rebound to $2.50 is possible if $2.00 holds, but $1.60 risks loom. Monitor X trends and trade smart!
Sign up on Tapbit and start your trading journey!