
In the fast-paced world of cryptocurrency, prices can surge or plummet in moments. For traders, navigating this volatility without a map is a recipe for losses. This is where reading crypto charts becomes not just useful, but absolutely crucial.
At Tapbit, we believe empowering our users with knowledge is key to their success. This guide will walk you through the fundamentals of reading charts using our integrated, user-friendly TradingView tools.
Why Reading Charts Is Important In Crypto Trading?
Cryptocurrency markets are renowned for their high volatility, where significant price movements can occur within hours or even minutes—unlike traditional assets. Without the ability to interpret charts, traders often fall prey to emotional reactions, buying at peaks and selling at bottoms. Technical analysis, the study of historical price data, provides a structured way to navigate these fluctuations.
By applying technical analysis, you can identify market trends—whether the asset is in an uptrend , downtrend, or moving sideways. Understanding the trend helps you follow a core trading principle: buy dips during upward movements and sell rallies during declines. Additionally, technical analysis allows you to pinpoint key support and resistance levels—price zones where an asset has historically reversed or stalled. These levels offer critical insight for planning entry and exit points. Charts also reflect market sentiment. Most importantly, by identifying these key levels, you can set precise stop-loss orders to protect your capital—a fundamental risk management practice for sustainable trading on Tapbit.
Step-By-Step Guide To Using Trading Charts On Tapbit
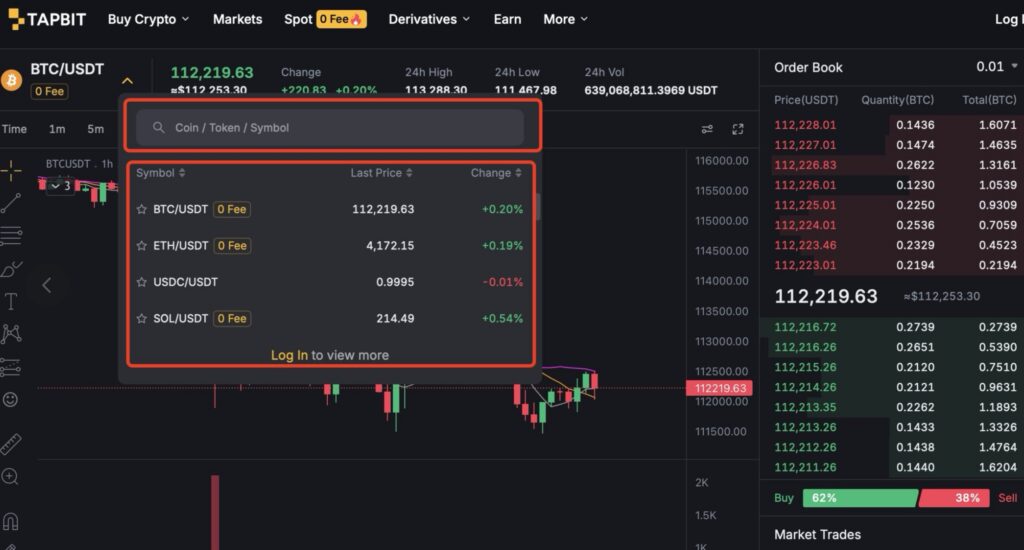
STEP 1: Search For The Cryptocurrency You Want To Analyze
Locate the search bar at the top of the trading interface. Simply type the asset’s symbol, such as “BTC” for Bitcoin or “ETH” for Ethereum. From the dropdown results, click on your desired trading pair (e.g., BTC/USDT). You will be directed to the detailed price page, which automatically loads the relevant charts, market data, and recent price activity.
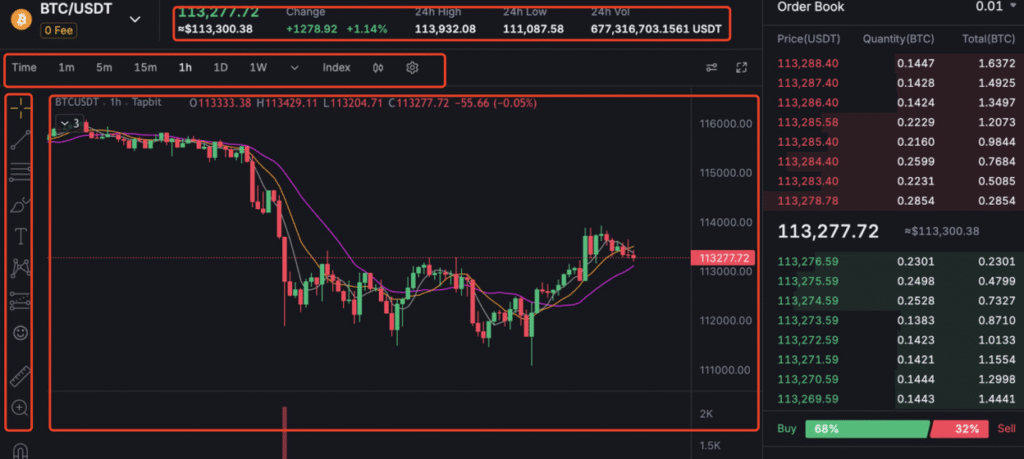
STEP 2: Familiarize Yourself With The Trading Chart Interface
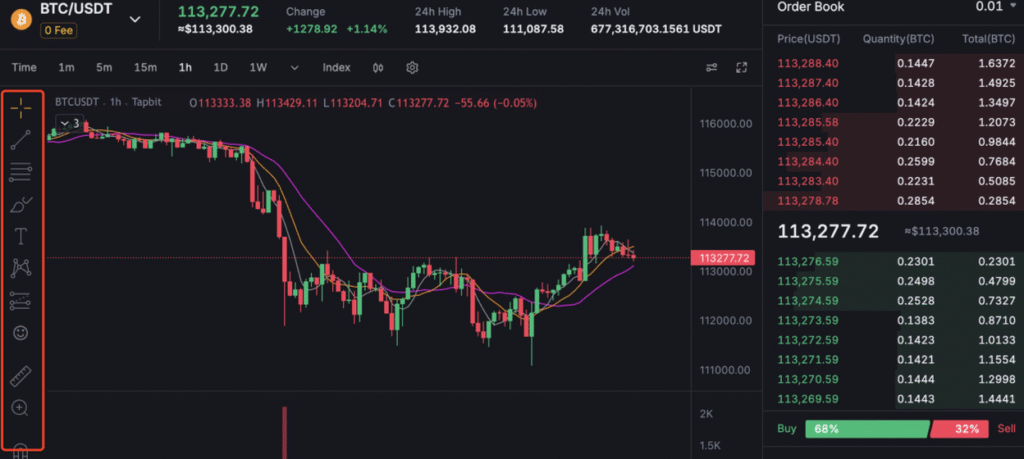
The charting area, powered by Tapbit, offers a rich set of tools designed for in-depth analysis. Key components include:
- Toolbar: Situated above the chart, it provides quick access to technical indicators, chart types, and timeframe settings.
- Chart Area: The central space where price movements are visualized.
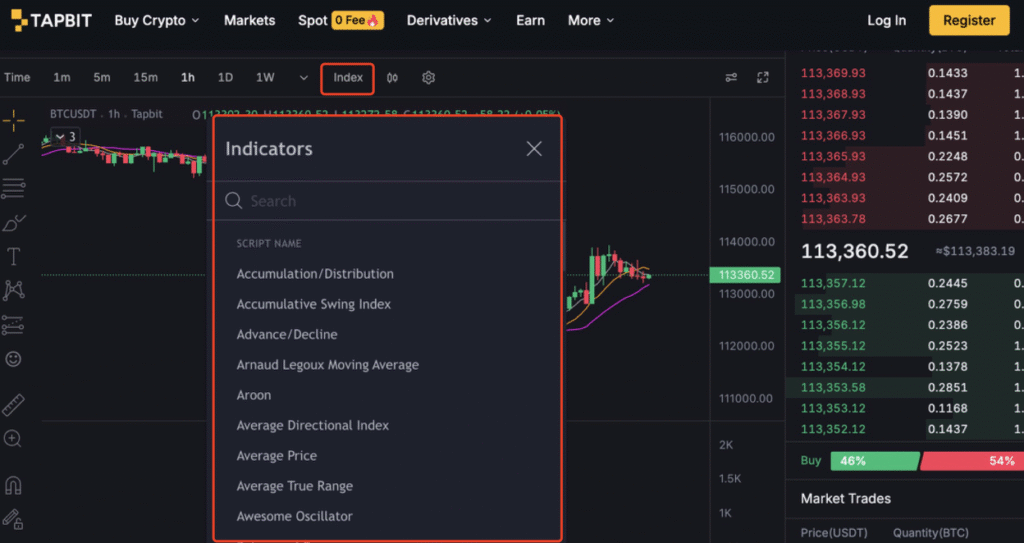
- Indicators & Strategies Panel: A dedicated section where you can apply and customize technical indicators like RSI, MACD, and Bollinger Bands.
- Drawing Tools:located on the left of the chart, are used for manual technical analysis, allowing you to mark up the price chart directly to identify trends, key price levels, and potential patterns to inform your trading decisions
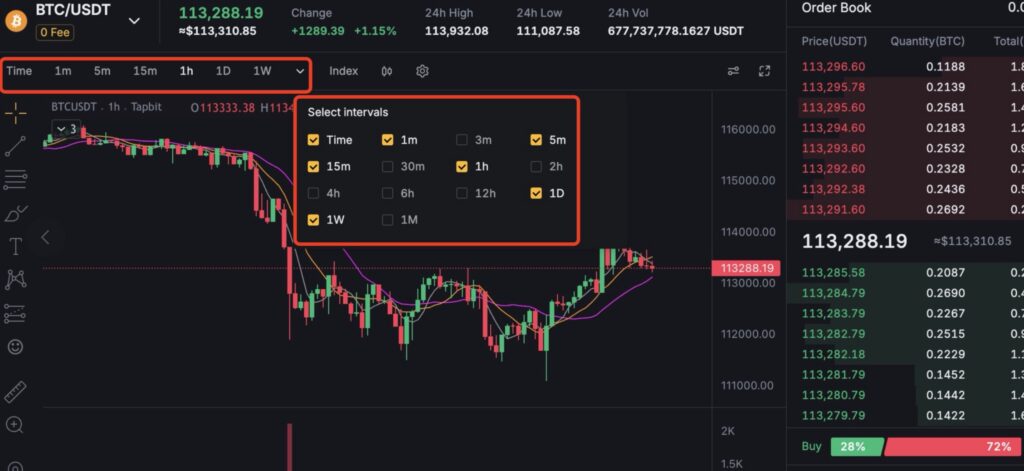
STEP 3: Adjust The Timeframe According To Your Strategy
The timeframe toolbar, located at the top of the chart, allows you to customize the period displayed—from tick-by-tick data to multi-month views. Choose a timeframe that aligns with your trading style:
- Scalpers and day traders often use 1-minute to 1-hour charts.
- Swing traders may prefer 4-hour or daily views.
- Long-term investors typically focus on weekly or monthly charts to capture broader trends.
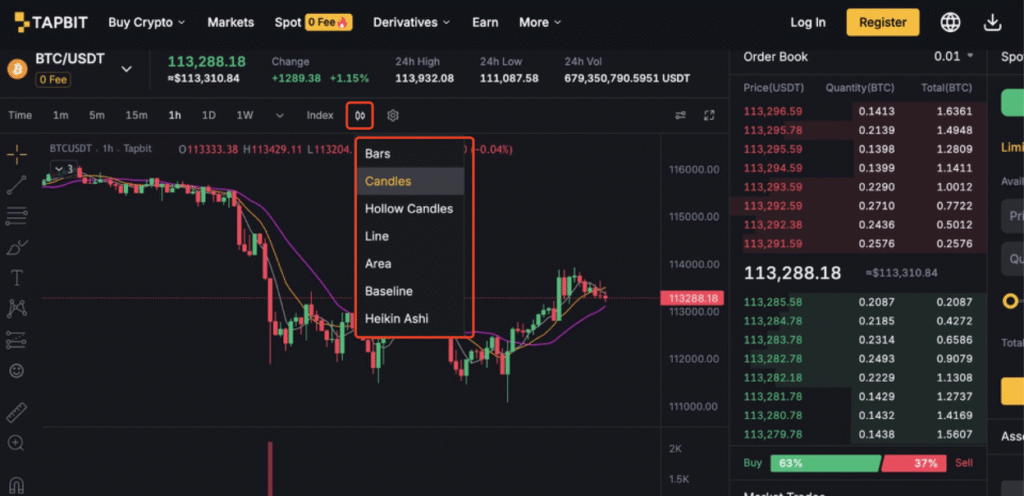
STEP 4: Explore Different Chart Types For Varied Insights
Tapbit supports multiple chart formats, each offering unique advantages:
- Candlestick Charts: Ideal for visualizing open, high, low, and close prices within a period. Great for identifying momentum and reversal patterns.
- Line Charts: Simplified view using closing prices, helpful for recognizing long-term trends.
- Heikin Ashi: A modified candlestick method that filters out market noise, making trends easier to identify.
- Bar Charts and Area Charts: Alternative visualizations suited for different analytical preferences.
STEP 5: Apply Technical Indicators For Deeper Analysis
To perform a more robust market analysis, you can enhance your chart with a variety of built-in technical indicators available in the TradingView panel. The first layer of analysis often begins with Trend Indicators, such as Moving Averages (MA) and the Ichimoku Cloud, which are designed to help you identify and confirm the underlying market direction, filtering out short-term noise. Once the trend is established, Momentum Oscillators, like the Relative Strength Index (RSI) , become valuable for gauging the speed and strength of price movements, effectively signaling potential overbought or oversold conditions that may precede a reversal. Finally, to confirm whether a price move is supported by market participation, Volume-Based Tools such as On-Balance Volume (OBV) are essential, as they provide a third dimension to your analysis by validating the strength behind breakouts or trend changes. By combining these different classes of indicators, you can build a more comprehensive and informed trading thesis.
STEP 6: Use Drawing Tools To Mark Key Levels And Patterns
Tapbit’s charting toolkit includes powerful annotation features for manual analysis, allowing you to mark up price charts directly to enhance your technical evaluation. For instance, you can use Trendlines and Channels to visually define crucial support and resistance levels, helping you anticipate potential price breakouts or rejections. Another powerful instrument is Fibonacci Retracement, which enables you to identify potential reversal levels by drawing horizontal lines based on key mathematical ratios after a significant price movement. Additionally, the toolkit provides various Shape and Text Tools that let you highlight important chart patterns, such as triangles or head-and-shoulders, and add custom notes directly onto the chart for future reference, creating a personalized and well-documented trading plan.
Unlock Your Crypto Market Analysis Potential
As we’ve explored, Tapbit provide a comprehensive suite of professional charting tools, making advanced technical analysis accessible to traders of all experience levels. From selecting the right timeframe and chart type to layering indicators and annotating key levels, each step brings greater clarity to market movements. Remember, consistent proficiency in chart analysis is developed through practice and continuous learning.
We encourage you to log in to your Tapbit account and apply these techniques directly on our charts. With our zero-fee spot trading and robust trading environment, you can practice and refine your strategies in real market conditions. Start charting your path to smarter trading decisions today.