
Ethereum has managed to claw its way back above the psychologically crucial $3,000 level following a recent dip that swept liquidity from below it. However, is this a trap for bulls, or the start of the next bull run? The bounce is weak, and the charts are flashing warning signs. Let’s break down the key signals to watch.
A Fragile Technical Footing
The current price action reveals a market in a delicate balance. While ETH has posted a modest 1.75% gain in the last 24 hours, it remains deep in the red over the past week, down over 10%. The technical structure has turned bearish, with the failure to reclaim the 100-day moving average near $3,800 triggering a sustained selloff. A significant shift is the 200-day moving average now positioned above the price, confirming weakening medium-term momentum.
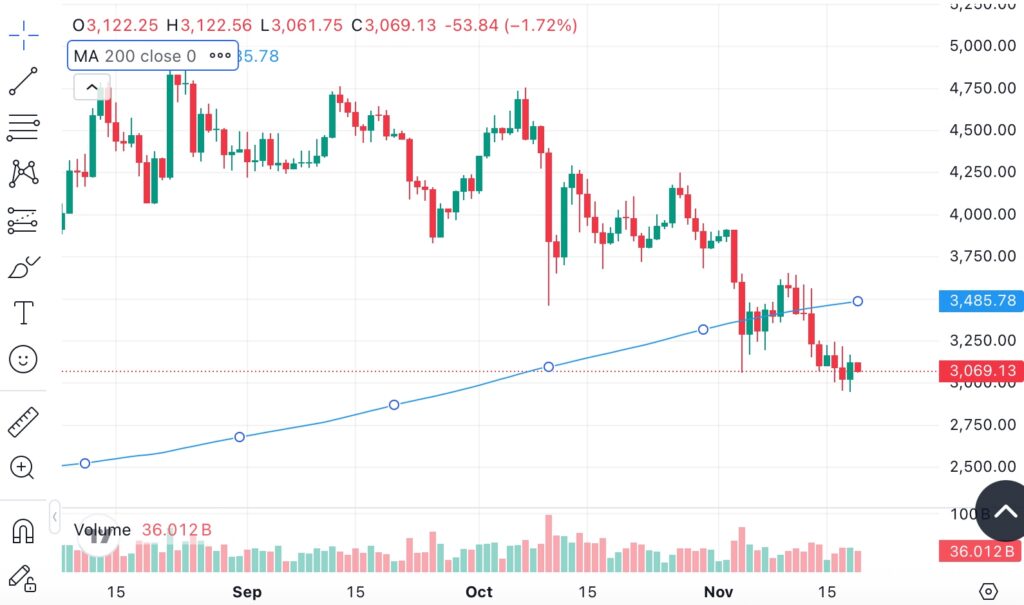
The key observation is the compressed daily candle bodies with long wicks to the downside, suggesting that buying activity is absorbing selling pressure right at the $3,000 demand threshold. This creates a potential springboard. If Ethereum can stabilize and form a higher low here, a corrective rebound toward the $3,400–$3,550 range is plausible.
But the risk is palpable. A daily close below $2,950 would invalidate this fragile support and open the path for a steeper drop toward the $2,600–$2,700 macro demand zone. The bears’ next logical target, if they seize control, would be a test of the $2,800 support level.
Fundamental Headwinds Cannot Be Ignored
The technical weakness is amplified by concerning fundamental signals that point to a broader “risk-off” environment.
- Institutional Exodus: Spot Bitcoin ETFs have recorded multiple consecutive days of net outflows, with single-day peaks exceeding a massive $800–$900 million. As the clearest indicator of U.S. institutional appetite, this sends an unambiguous signal: major players are reducing crypto exposure and are unwilling to take on risk in the short term.
- The Korean “Smart Money” Shift: The Korean market, often a sensitive barometer for global retail risk appetite, has undergone a dramatic rotation. Data shows Upbit trading volume has collapsed by 80% year-over-year. Meanwhile, retail forum discussions have pivoted almost entirely away from altcoins to AI and semiconductor stocks, coinciding with the KOSPI index soaring over 70% to new all-time highs. This “Great Migration” of speculative capital from crypto to traditional tech equities underscores a challenging liquidity environment for Ethereum.
Ethereum Price Struggles At $3,000: What’s Next For The Crypto?
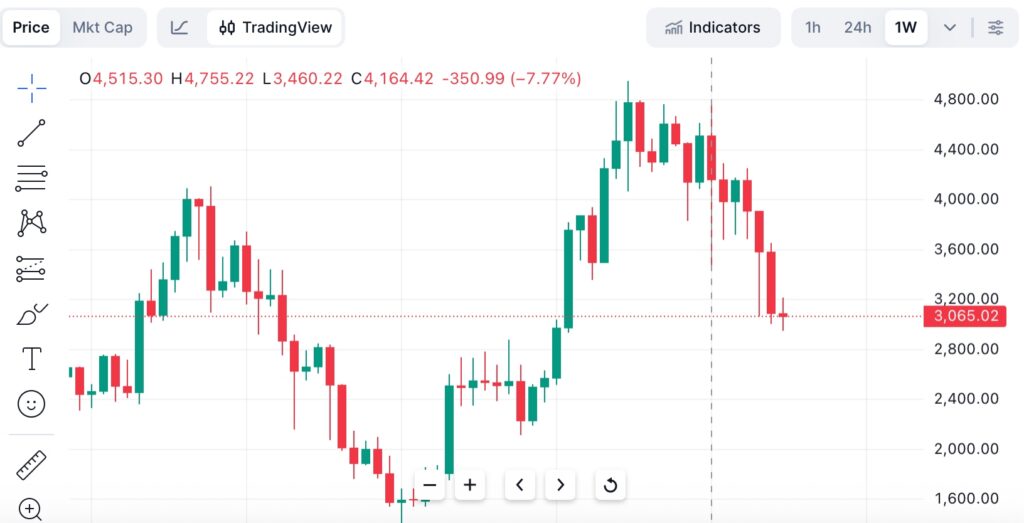
Ethereum is currently locked in a fierce battle at the critical $3,000 level, a former strong support that has now become the main battlefield between bulls and bears. Following the recent sharp decline, market sentiment remains exceptionally fragile, with every price movement closely watched by nervous investors.
From a technical perspective, Ethereum remains within a clear downward channel, consistently forming lower highs and lower lows – a pattern that hasn’t yet been broken. However, order book data reveals significant liquidity clustering in the $3,400-$3,600 range, providing a clear target for any potential rebound. While oversold technical indicators suggest a possible bounce, the crucial question remains whether bulls can gather enough strength to push prices above key resistance levels.
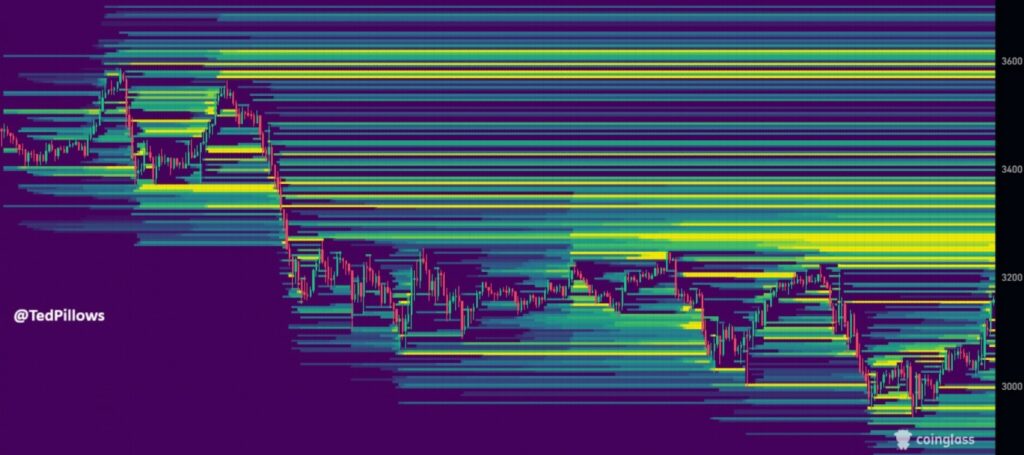
Market sentiment presents a divided picture. On one hand, the break below $3,000 triggered widespread panic, with many investors fearing this could mark the beginning of a more substantial downtrend. On the other hand, on-chain data tells a different story: whale addresses have been accumulating substantial positions during this decline, with over $1 billion worth of Ethereum purchased by these smart money players. This pattern of institutional greed amid retail panic often signals that markets may be approaching a temporary bottom.
The $3,000 level has become the decisive line for Ethereum’s short-term destiny. If bulls can successfully defend this position and further drive prices to reclaim the $3,350 level, it would likely break the current bearish structure, opening the path for a rebound toward the $3,400-$3,600 zone. Conversely, if daily closing prices clearly break below $2,950, it would indicate the downward trend may continue, with the next significant support level looking toward the $2,600-$2,800 range.
This battle at the $3,000 mark represents more than just technical trading – it’s a psychological contest between market participants. Is this the end of the bull market, or simply a deep shakeout within an ongoing uptrend? The answer likely lies in the outcome of this crucial price level struggle. As markets approach a potential turning point, investors should closely monitor price action around these key technical levels and track changes in on-chain fund flows, as these signals will provide important clues about the next trend direction.
Trade Smarter: Navigate ETH’s Key Levels With Zero Fees On Tapbit
Ethereum stands at a critical crossroads, trapped between technical fragility and conflicting market signals. The struggle at $3,000 encapsulates the entire market’s dilemma: this level could either become the launching pad for a significant relief rally or the trapdoor to a deeper correction.
For traders and investors, the path forward comes down to specific price levels. The bullish scenario only gains credibility if Ethereum can reclaim $3,350, which would break the immediate bearish structure and open the path toward $3,400-$3,600. Conversely, a daily close below $2,950 would likely trigger the next leg down toward $2,600-$2,800.
For smarter Ethereum investing, choose Tapbit. Trade ETH with zero fees and keep more of your profits.