
If you traded WAI (World3) over the last 24 hours, you either caught a massive fundamental re-rating or got chopped to pieces in a brutal 265% volatility band.
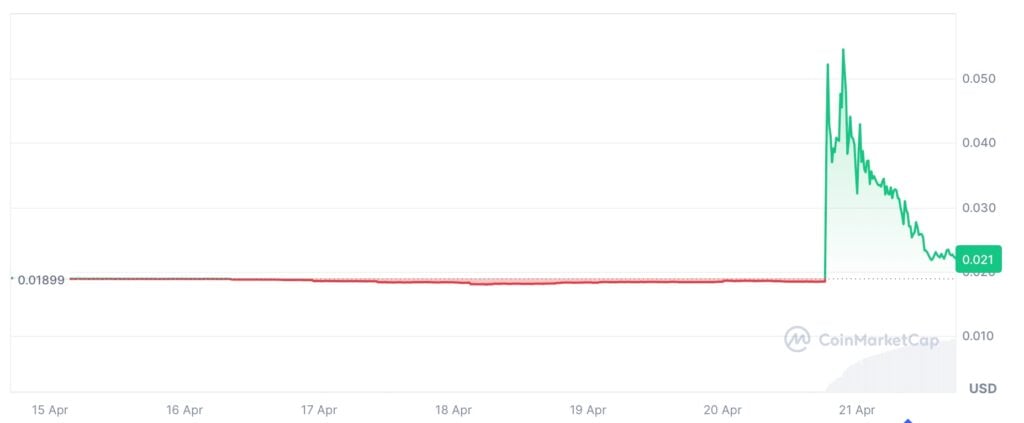
The price action has been violent. WAI bounced from a floor of $0.0184, squeezed all the way up to $0.05428, and is currently suffering a deep, fragmented retracement—trading anywhere between $0.021 and $0.032 depending on which exchange’s order book you are looking at.
Retail traders often view these charts as pure casino action. But on the institutional side, this is exactly what it looks like when a low-cap project suddenly drops hard, verifiable data that forces the market to completely re-evaluate its price.
Here is our desk’s breakdown of the fundamental catalyst, the volume metrics, and how to manage risk on the retracement.
The Catalyst: Hard Data over “Meme” Promises
The market is exhausted by crypto projects claiming to do “AI” without showing any actual product. On April 20, World3 published its AI Strategy Whitepaper, and the reason the token squeezed 200%+ is because the paper contained tangible, on-chain consumption metrics.
According to the official release, the network is not just a concept; it is live and burning tokens. The core data points that triggered the institutional scanners include:
- Real Network Load: The protocol has processed over 100 billion LLM (Large Language Model) tokens.
- Ecosystem Penetration: It is currently integrated with 20 different AI providers and 52 specific models.
- Developer Traction: Over 10,000 active developers are on the network, with more than 1,200 functional AI Agents already deployed via the TapClaw platform.
- The Deflationary Kicker: Most importantly for traders, the whitepaper cited a network consumption of 150 million WAI.
When a project proves it has an actual “consumption and deflation” model rather than just speculative inflation, algorithmic bots and fundamental spot buyers rush in simultaneously. That is what sparked the run from $0.018.
The Mechanics of the Dump: Why Did It Fade to $0.021?
If the whitepaper data is so strong, why did the price aggressively puke from $0.054 back down to the low $0.02s? It comes down to basic market mechanics and liquidity flow.
- Extreme Capital Rotation: According to CoinMarketCap, 24-hour trading volume spiked by 902.5%, hitting roughly $5.27 million. For a token with a circulating market cap floating near $10M, that means nearly half the entire tradable supply changed hands in a single day.
- The Profit-Taking Reality: Block explorers show no evidence of a malicious “rug pull” or singular whale manipulation. What you are seeing on the chart is heavy, systematic profit-taking. If a smart-money wallet accumulated at $0.018, they have a fiduciary duty to dump a portion of their bags into the retail FOMO when the price tags $0.067.
- Liquidity Gaps: During a 265% intraday move, market makers pull their liquidity to avoid getting run over. This causes massive spread gaps. This is why a trader looking at PancakeSwap might see $0.041, while a trader looking at a CEX order book sees $0.021. The deep wicks are a symptom of thin liquidity, not broken fundamentals.
Tapbit Strategy: How to Trade the Aftermath
WAI is currently in a high-risk price discovery phase. The market is trying to find a fair technical floor that prices in the new AI utility, while simultaneously absorbing the sell pressure from early buyers cashing out.
With upcoming catalysts like the RouterLink mainnet and the launch of their GPU computing power market, WAI will likely remain a high-beta, highly volatile asset.
Execution Rules:
- Kill the Leverage: Do not touch 20x or 50x perpetuals on an asset swinging 200% a day. The funding rates and sudden liquidity wicks will liquidate you, even if your directional bias is perfectly correct.
- Wait for the Base: The price is actively searching for a floor in the $0.021 to $0.025 zone. Do not try to catch the falling knife. Wait for the volume profile to cool off and for the asset to print three consecutive daily candles in a tight range before deploying heavy spot capital.
- Automate the Volatility: If you want to trade the chop, use a grid bot. Set a wide grid between $0.018 and $0.040. Let the bot passively buy the deep panic wicks and sell the dead-cat bounces.
Trade the data, not the panic. Manage your WAI exposure and execute your spot or grid strategies with institutional precision by logging into your Tapbit account today.
Frequently Asked Questions (FAQ)
Are the numbers in the World3 whitepaper verified?
The metrics (100B LLM tokens, 1,200 TapClaw agents) are self-reported by the World3 development team in their April 20th official release. However, because Web3 infrastructure relies on public ledgers, the “150 million WAI consumption” metric is verifiable on-chain. The massive market reaction indicates that institutional players found the on-chain footprint credible.
Why is CoinMarketCap showing $0.032, but my exchange shows $0.021?
This is known as liquidity fragmentation. When an asset experiences a 900%+ volume surge, arbitrageurs cannot keep the prices identical across all decentralized and centralized exchanges fast enough. CoinMarketCap displays a volume-weighted average across all markets, while your specific exchange shows the exact price based purely on its localized order book depth.
Is the WAI rally over?
The initial momentum shock is cooling off, transitioning into a consolidation phase. Whether the rally continues depends entirely on execution. The market has priced in the current whitepaper data. To trigger the next leg up, the team will need to successfully deliver their next roadmap items: the RouterLink mainnet and the GPU compute marketplace.